Some Legend Has Statistically Analysed The Shit Out Of Every Single Episode Of ‘The Simpsons’
Ever wanted to know whether Carl or Lenny got more screen time? Was Springfield Elementary or Moe's Tavern a more common setting?
The Simpsons has been running for 28 seasons (Season 12 was the last good one though, am I right), but fans are still coming up with ways to dig further and further into the nuts and bolts of show. Now one programmer and giant Simpsons nerd has statistically analysed the script of every episode to answer questions we didn’t even know had been asked.
Ever wanted to know whether Carl or Lenny got more screen time? Was Springfield Elementary or Moe’s Tavern a more common setting? What was the gender balance on the show like? Thanks to Todd W. Schneider and his rigorous analysis of The Simpsons we can end these age old debates for good.
Schneider fed the script of every single episode into a program that ranked each character by how much dialogue they spoke, identified the most common settings and even tracked how the show changed over the years.
According to the analysis, the characters with the most dialogue across all seasons were, unsurprisingly, the Simpson family. But following Homer, Marge, Bart and Lisa was… Mr Burns!
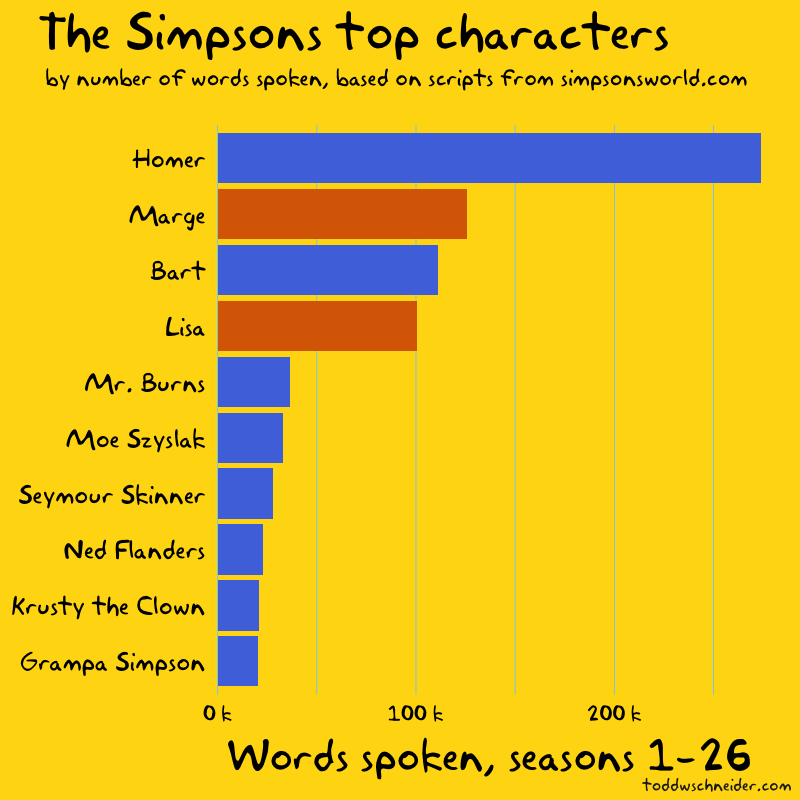
When it comes to the rest of the supporting cast, it turns out Lenny got more words in than Carl, Reverend Lovejoy edged out Sideshow Bob and Cletus had a bigger presence than Lionel Hutz. Only 25 percent of the dialogue in the show comes from women characters, and once you exclude Marge and Lisa that figure drops to 10 percent.
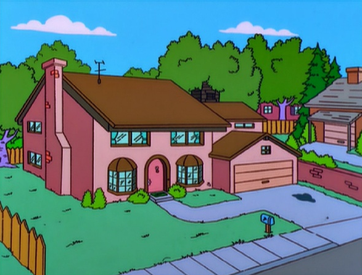
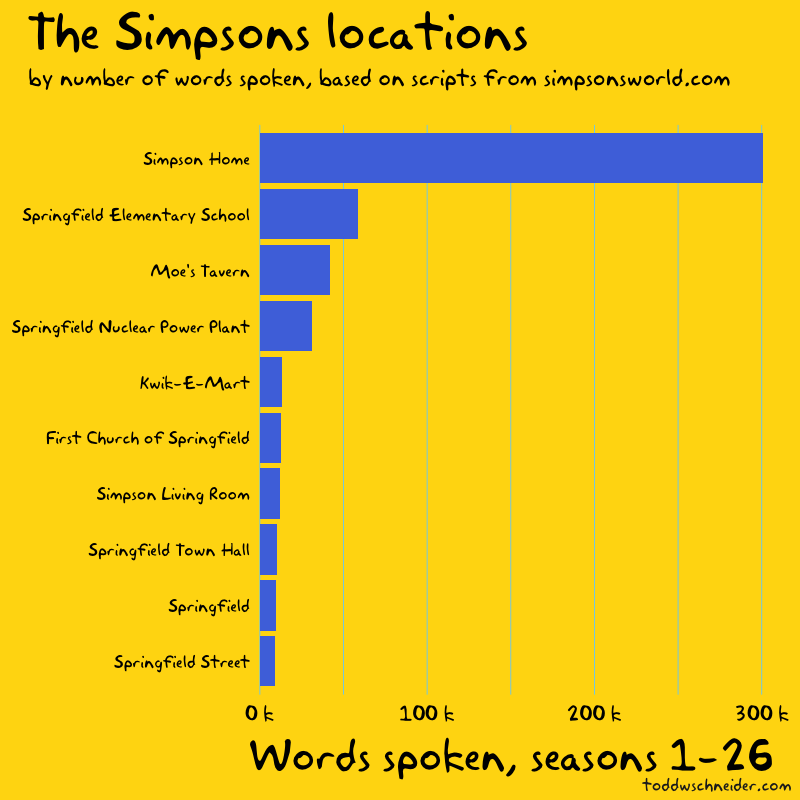
Far and away the most popular setting in the show was the Simpson family home home at 742 Evergreen Terrace.
It was followed by Springfield Elementary, Moe’s Tavern and the power plant.
By analysing each line of dialogue, it’s also possible to track whether the show’s characters became more or less prominent over time. For example, Bart went from having 15 percent of the show’s total dialogue in Season 1 to about 7 percent in the latest season.
Probably the best bit of Schneider’s analysis (or at least my favourite bit) is his use of some fancy statistical technique called “term frequency–inverse document frequency” to replace official episode titles with words that better summarise what that episode was actually about.
For example, the analysis turns the episode called ‘Last Exit to Springfield’ into ‘Dental Plan’, a much more accurate description, and it’s what every Simpsons fan calls that episode anyway.

‘Krusty Gets Kancelled’ becomes ‘Gabbo’, ‘Lisa the Vegetarian’ becomes ‘You Don’t Win Friends With’ and ‘Marge Be Not Proud’ is more sensibly described as ‘Bonestorm’.
All up, it’s a really fun look at the mechanics behind one of the greatest bits of pop culture ever created. You can check out Schneider’s full analysis here.